Rethinking Debugging for Real Automation Journeys
Expanded debugging from single-automation checks to an end-to-end experience across parent and child automations.
Timeline
6 months
Team
1 Designer · 1 PM · 1 Engineering Architect · 3 Developers · 1 Program Manager · 1 Documentation · 2 SDETs
My role
Lead Designer (IC)
Persona
Pro Developer & Citizen Developer
Context
Debugging, in simple terms
Debugging
Finding and fixing what is going wrong in a flow or program.
Breakpoint
A pause point used to inspect what is happening.
Watch variables
A way to track how selected values change while the flow runs.
Call stack
The execution path showing which parent or child automation is running.
Problem snapshot
Where the existing debugger fell short
The bot editor already had a debugger, but it only supported the current automation. As soon as a flow involved child automations (sub-bots, nested automations, invoked tasks, or reusable modules) the experience became fragmented.
Existing limitations
- Debugging worked only for the current automation
- Child automations had to be debugged separately
- Values could not be passed from parent to child during debugging
- Users often hardcoded values into child automations for testing
- Those temporary changes had to be manually cleaned before production
- There was no ability to edit variable values while debugging
- Users relied on message boxes, text logs, and audit files to understand what was happening
Impact on users
- Slow troubleshooting
- Too much manual setup
- Error-prone workflow
- Harder to trace failures
- Poor visibility across parent-child execution
- High friction for both pro and citizen developers
Design process
Design process that adapts to the problem

I don't believe in following one rigid design-thinking template for every problem. The process changes based on the level of ambiguity, technical depth, and user complexity involved.
For this debugger challenge, the work required domain learning, user research, systems mapping, prioritization, iterative design, and post-release feedback. The solution emerged by adapting the process to the problem rather than forcing the problem into a predefined framework.
“Good process adapts to the shape of the problem.”
How the work unfolded
- 0101
Align on context
Worked with stakeholders to understand the current product, the existing debugger, technical constraints, and why this problem mattered now.
- 0202
Learn the domain
Built foundational understanding of debugging concepts and terminology through online research, videos, and conversations with developers.
- 0303
Map the journey
Created a debugging journey map to understand where the existing experience broke down and where end-to-end support was missing.
- 0404
Hear from users
Collected pain points through surveys, external user interviews, and conversations with internal automation creators from Automation Anywhere's CoE team.
- 0505
Study the landscape
Reviewed competitors and adjacent tools to understand patterns, gaps, and opportunities.
- 0606
Create a plan
Translated research into a structured direction for what needed to improve and in what order.
- 0707
Prioritize
Used techniques such as MoSCoW to prioritize enhancements and shape a phased approach.
- 0808
Explore through wireframes
Converted priorities into early experience concepts and wireframes.
- 0909
Groom with stakeholders
Reviewed the solution with stakeholders across multiple rounds, refined the direction, and balanced usability with feasibility.
- 1010
Move to high-fidelity design
Developed polished UI once the core direction became clearer through iterations and grooming.
- 1111
Validate in implementation
Worked with SDETs during implementation to ensure the experience held up in practice.
- 1212
Learn after release
Connected with users post-release to understand what improved and what they still wanted next.
Journey mapping
Mapping the debugging journey
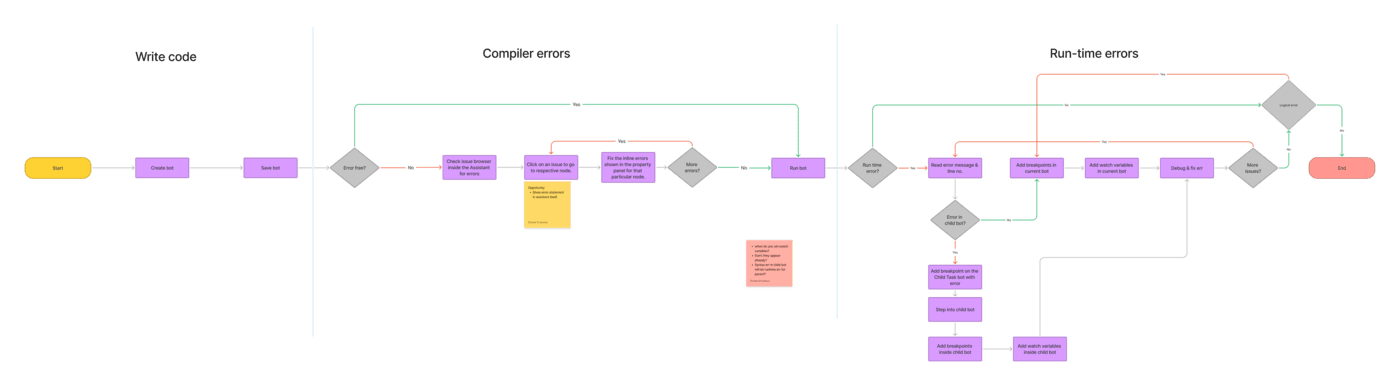
Mapped the overall debugging journey to identify where the current experience broke down across parent and child automations, and where visibility, traceability, and usability needed to improve.
Research
Grounding the problem in real user input
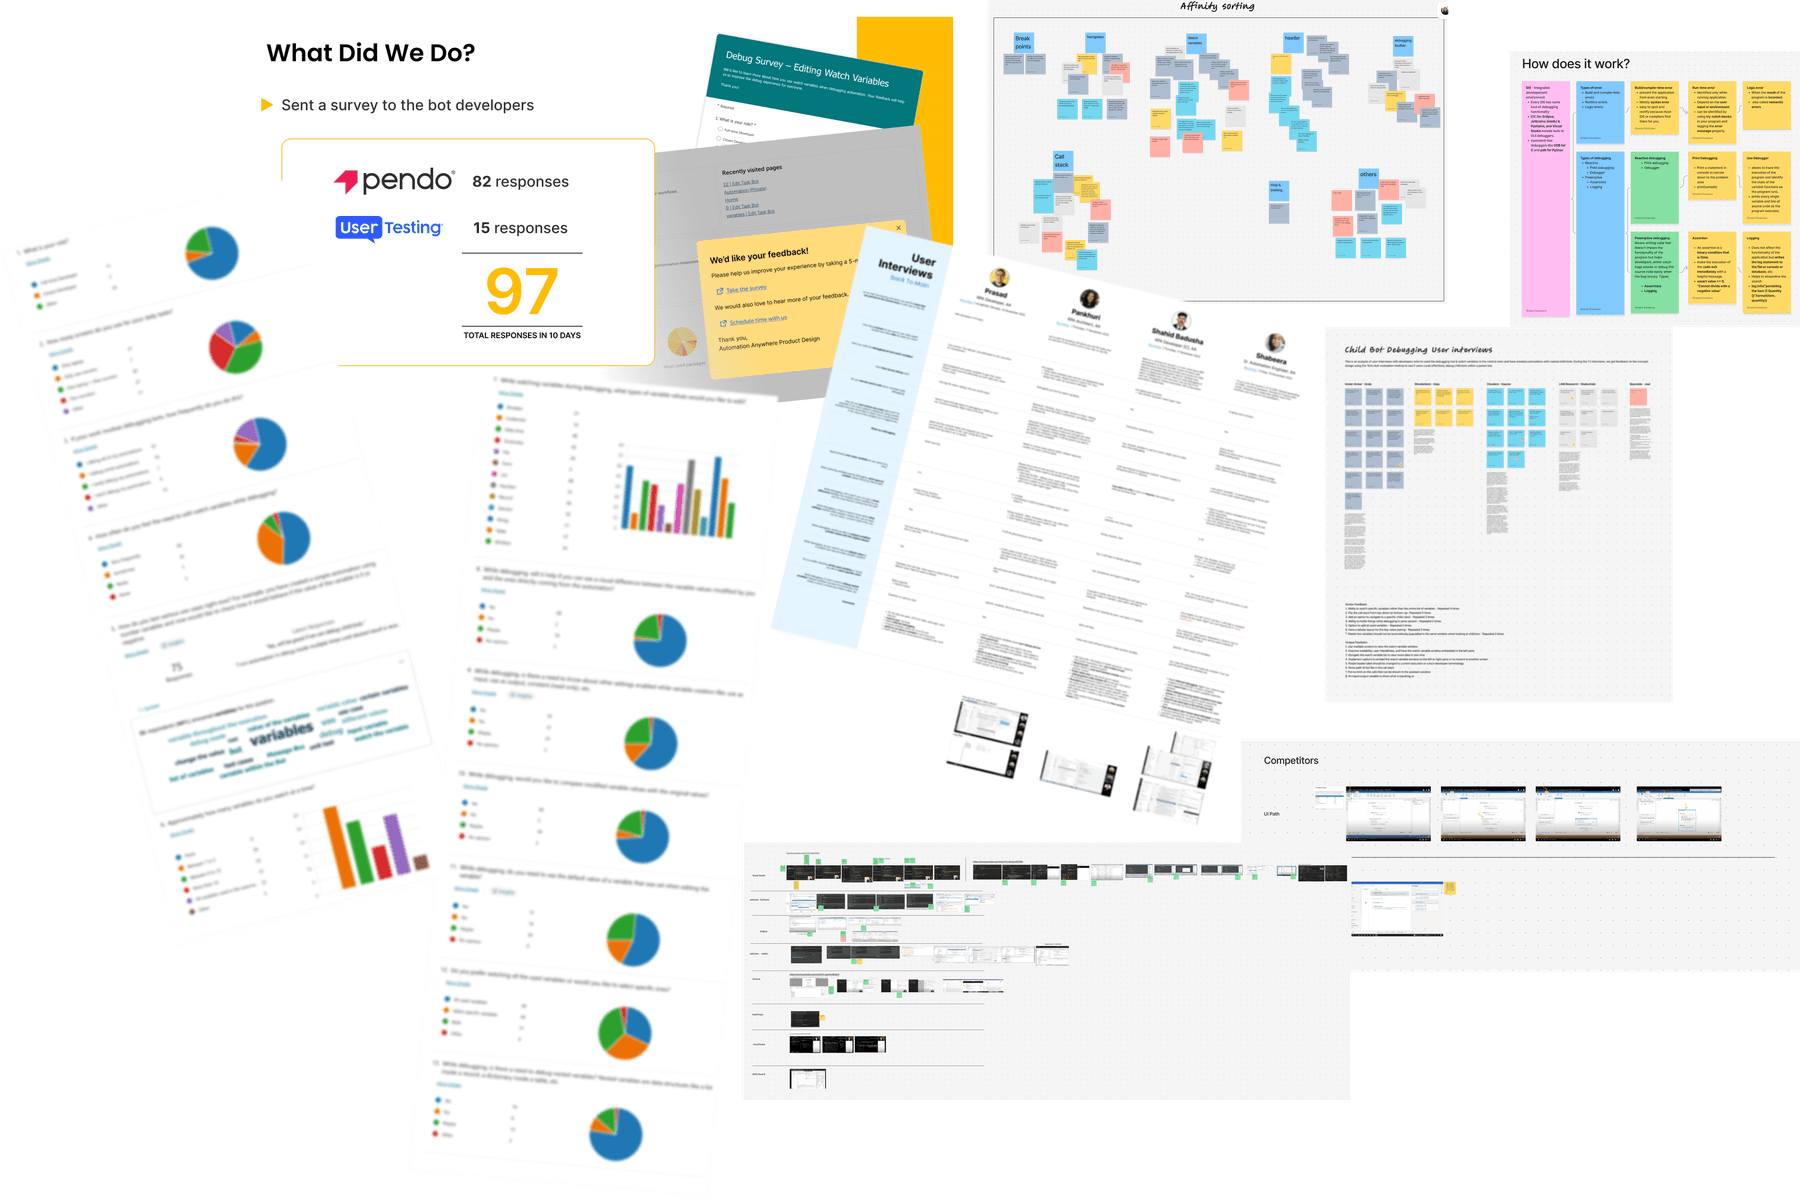
The direction was informed by a mix of stakeholder conversations, surveys, external user interviews, internal automation creators from Automation Anywhere's CoE team, competitive analysis, and adjacent tool review.
The goal was to understand both the technical expectation of debugging and the real workflow pain users experienced in this product context.
Key findings
What became clear
Local debugging was not enough
Users needed to understand what happened across parent and child automations, not treat each automation as an isolated unit.
Expert mental models could not define the whole experience
Designing only for users already fluent in IDE debugging would make the feature harder for citizen developers to understand and adopt.
Visibility had to improve without overwhelming the user
The challenge was to make hierarchy, execution flow, and variable tracing clearer without creating information overload.
Design challenge
Why this was a hard UX problem
This challenge was not only about adding more debugging capability. It was about shaping that capability into something users could actually understand and use.
The core complexity came from:
Design decisions
Key design decisions
Drill-down over full expansion
Sub-bots were not shown fully expanded inside the parent flow. A drill-down model reduced overload and helped preserve clarity.
Industry-standard terminology
Terminology stayed aligned with familiar debugging language to reduce ambiguity and improve cross-functional alignment.
Designed for both user groups
The experience was shaped for pro developers and citizen developers, rather than optimised only for expert users.
End-to-end traceability as the core value
The design focused on helping users follow execution, understand data flow, and locate failures across automation boundaries.
Balanced feasibility with usability
The solution was shaped by both what would help users most and what was practical to implement well.
Prioritization
From possibilities to a phased plan
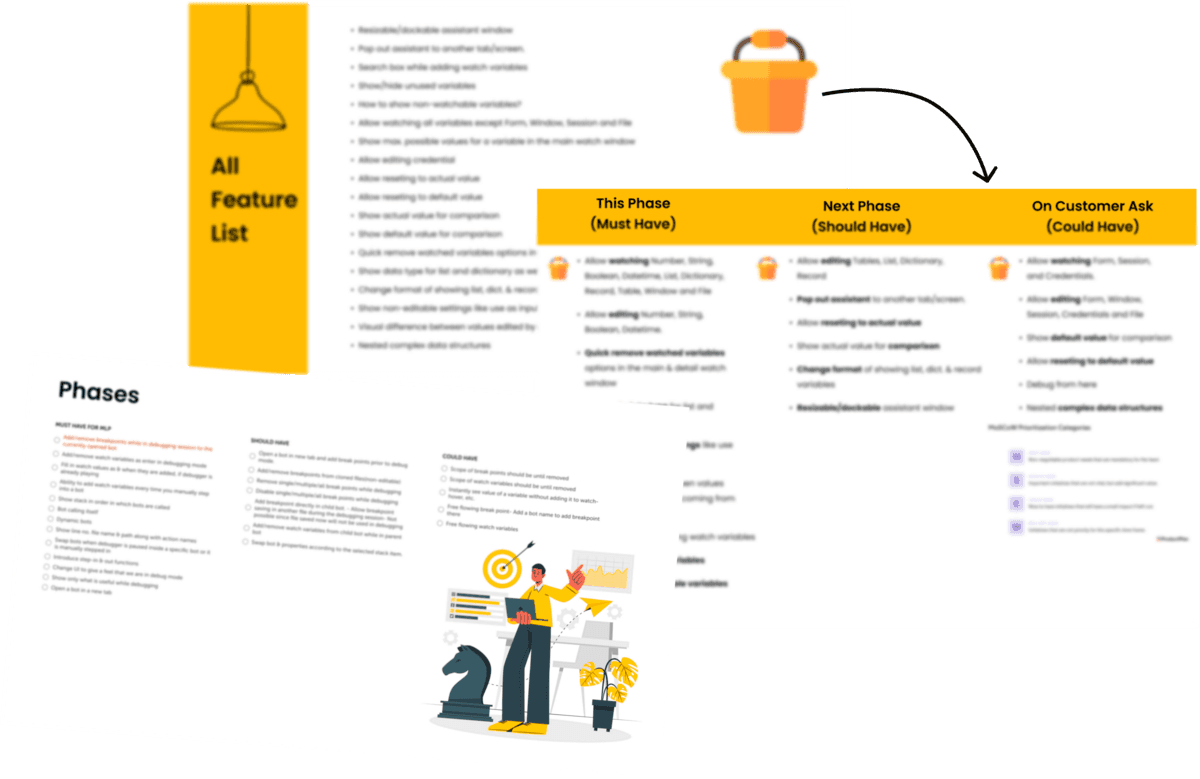
Once the opportunity space became clearer, enhancement ideas were organised into a phased plan. Prioritization techniques were used to decide what needed to be addressed first, what could follow later, and what should intentionally stay out of scope for the initial version.
Shaping the solution
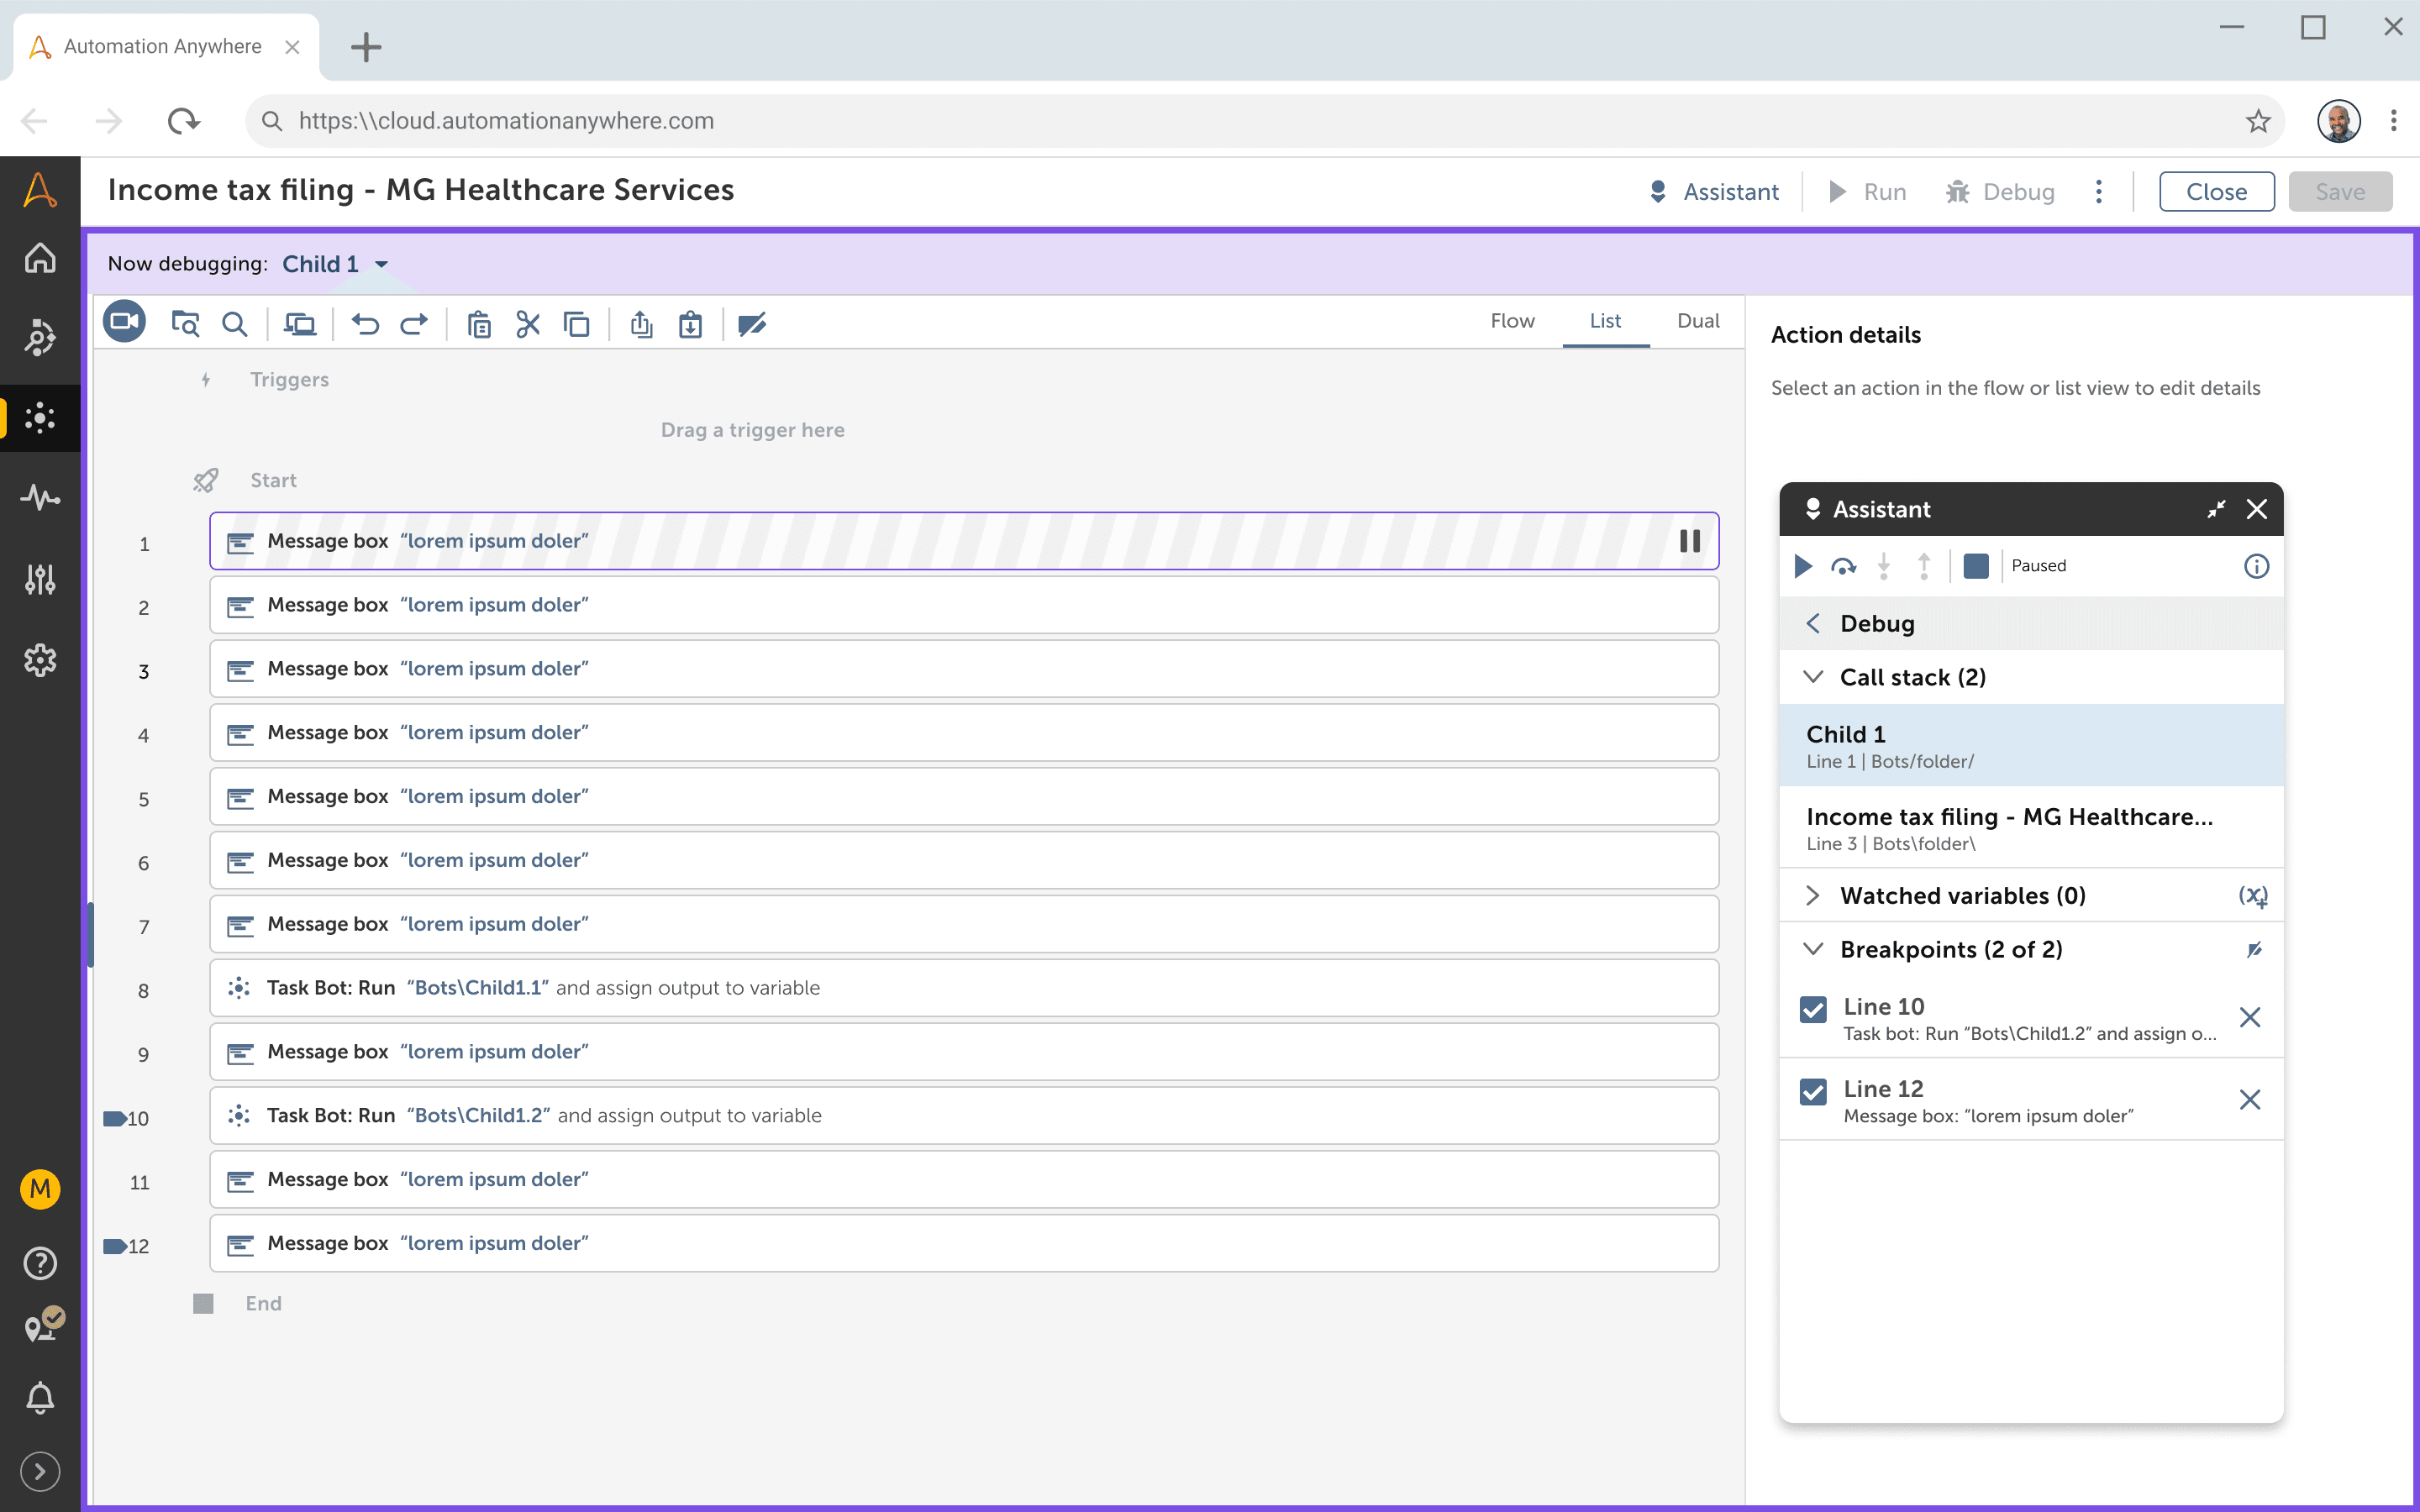
Shaping the solution through iteration
The solution evolved through multiple rounds of grooming, iteration, and feedback. High-fidelity designs refined hierarchy, navigation, and clarity across the full debugging flow.
Outcome
What changed
Reduced the need to debug each child automation separately
Reduced dependence on message boxes, text logs, and audit files
Lowered the risk of debug-related changes reaching production
Reduced manual hardcoding and cleanup during testing
Improved the ability to troubleshoot more realistic automation journeys
Reduced time and effort required to debug across the flow
Post-release feedback
What users asked for next
Post-release feedback helped uncover what users wanted next from the debugging experience. Some requests were deferred due to time or bandwidth limitations, while others were intentionally left out of the first version to keep the initial experience focused and easier to adopt.
Efficiency
- Reverse the order of the call stack
- Instantly see the value of a variable without adding it to watch, such as hover-based preview
Control
- Edit complex variables such as tables during debugging
- Fix bugs while debugging
Flexibility
- Pop out the debugger onto another screen
These requests helped clarify what a future roadmap could look like once the core end-to-end debugging experience had proven useful.
End of case study